使用Graphviz创建图表

转载自:https://ncona.com/2020/06/create-diagrams-with-code-using-graphviz/

您是否曾为绘制过架构图时重复的单击和拖动而感到乏味?

您是否需要对该图进行修改发现改动却很复杂?

Graphviz 是一个开源的图形可视化软件,它使我们能够使用代码描述图表,并为我们自动绘制。如果将来需要修改该图,我们只需要修改描述代码,节点和边将自动为我们重新定位。

绘制图形

在开始编写图形之前,我们需要学习如何将代码转换为图像,以便可以测试正在做的事情。

Webgraphviz.com 可用于从浏览器绘制图形。

我们可以使用 apt 在 Ubuntu 中安装命令行工具:

1
1 sudo apt install graphviz

在 macOS 环境 使用 brew 安装

1
brew install graphviz

除其他外,这将安装 dot CLI,该CLI可用于从文本文件生成图像:

1
1 dot -Tpng input.gv -o output.png

在上面的示例中,我们将 png 指定为output(-Tpng),但是有许多可用的选项。如我们所见,输入文件通常使用gv扩展名。

DOT

DOT是用于描述要由Graphviz解析的图形的最常见格式。

基本

一个简单的图形具有以下形式:

1
2
3
graph MyGraph { 
begin -- end
}

具有两个节点的基本图

如果要使用有向图(带箭头),则需要使用digraph

1
2
3
digraph MyGraph {  
begin -> end
}

基本有向图

箭头可以单向或双向:

1
2
3
4
digraph MyGraph {  
a -> b
a -> c [dir=both]
}

带有双向箭头的图

形状

如果我们不喜欢椭圆形,可以使用其他形状:

1
2
3
4
5
6
7
8
9
10
11
12
13
14
15
16
17
18
19
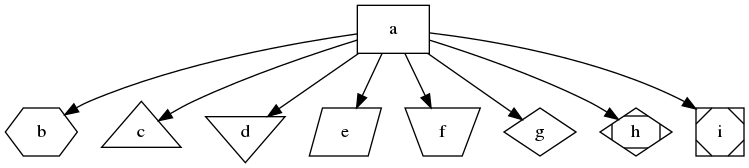
digraph MyGraph {
a [shape=box]
b [shape=polygon,sides=6]
c [shape=triangle]
d [shape=invtriangle]
e [shape=polygon,sides=4,skew=.5]
f [shape=polygon,sides=4,distortion=.5]
g [shape=diamond]
h [shape=Mdiamond]
i [shape=Msquare]
a -> b
a -> c
a -> d
a -> e
a -> f
a -> g
a -> h
a -> i
}

节点形状

可以在其文档的“ 节点形状”部分中找到不同的受支持形状。

我们还可以向节点添加一些颜色和样式:

1
2
3
4
5
6
7
8
9
10
11
12
13
14
15
16
17
18
19
20
21
22
23
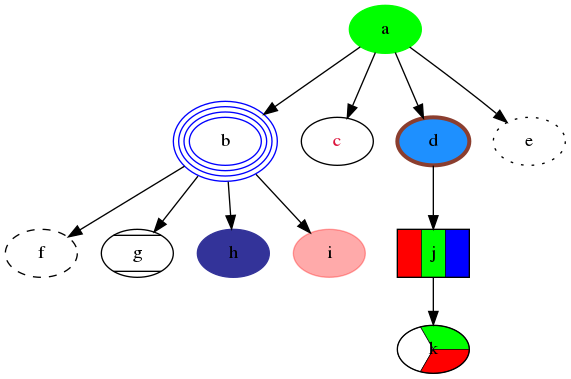
digraph MyGraph {
a [style=filled,color=green]
b [peripheries=4,color=blue]
c [fontcolor=crimson]
d [style=filled,fillcolor=dodgerblue,color=coral4,penwidth=3]
e [style=dotted]
f [style=dashed]
g [style=diagonals]
h [style=filled,color="#333399"]
i [style=filled,color="#ff000055"]
j [shape=box,style=striped,fillcolor="red:green:blue"]
k [style=wedged,fillcolor="green:white:red"]
a -> b
a -> c
a -> d
a -> e
b -> f
b -> g
b -> h
b -> i
d -> j
j -> k
}

节点形状样式

可以在 颜色名称文档 中找到不同的 颜色名称

箭头

箭头的尾巴和头部也可以修改:

1
2
3
4
5
6
7
8
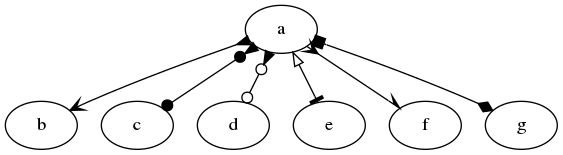
digraph MyGraph {
a -> b [dir=both,arrowhead=open,arrowtail=inv]
a -> c [dir=both,arrowhead=dot,arrowtail=invdot]
a -> d [dir=both,arrowhead=odot,arrowtail=invodot]
a -> e [dir=both,arrowhead=tee,arrowtail=empty]
a -> f [dir=both,arrowhead=halfopen,arrowtail=crow]
a -> g [dir=both,arrowhead=diamond,arrowtail=box]
}

箭

可以在箭头形状文档中找到不同的箭头类型。

以及向箭头线添加样式:

1
2
3
4
5
6
7
8
9
10
11
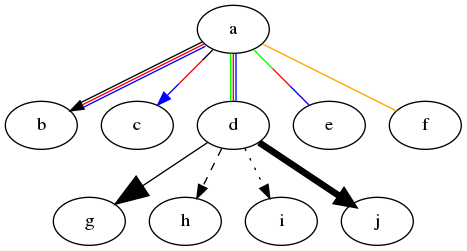
digraph MyGraph {
a -> b [color="black:red:blue"]
a -> c [color="black:red;0.5:blue"]
a -> d [dir=none,color="green:red:blue"]
a -> e [dir=none,color="green:red;.3:blue"]
a -> f [dir=none,color="orange"]
d -> g [arrowsize=2.5]
d -> h [style=dashed]
d -> i [style=dotted]
d -> j [penwidth=5]
}

箭

如果我们注意上面的代码和图表,我们可以看到,当我们为箭头指定多种颜色时,如果不指定任何权重,每种颜色将只有一行。如果我们想要一个带有多种颜色的箭头,则至少一种颜色必须指定要覆盖的线条的重量百分比:

1
1  a -> e [dir=none,color="green:red;.3:blue"]

标签

我们可以向节点添加标签:

1
2
3
4
5
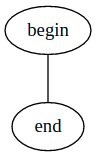
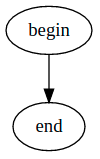
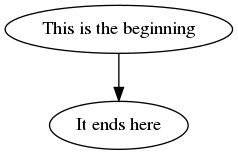
digraph MyGraph {
begin [label="This is the beginning"]
end [label="It ends here"]
begin -> end
}
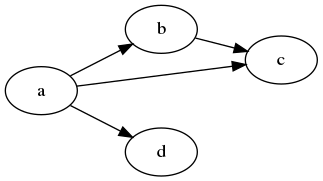
标签

以及顶点:

1
2
3
4
5
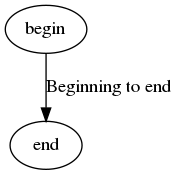
digraph MyGraph {
begin
end
begin -> end [label="Beginning to end"]
}
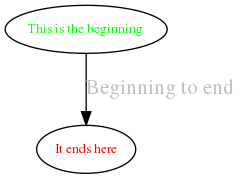
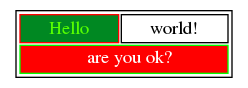
Vertix标签

我们可以设置标签样式:

1
2
3
4
5
digraph MyGraph {
begin [label="This is the beginning",fontcolor=green,fontsize=10]
end [label="It ends here",fontcolor=red,fontsize=10]
begin -> end [label="Beginning to end",fontcolor=gray,fontsize=16]
}

标签样式

集群

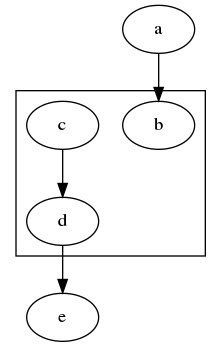
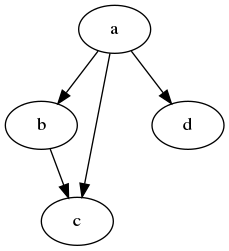
聚类也称为子图。集群的名称必须以开头cluster_,否则将不会包含在框中。

1
2
3
4
5
6
7
8
digraph MyGraph {
subgraph cluster_a {
b
c -> d
}
a -> b
d -> e
}
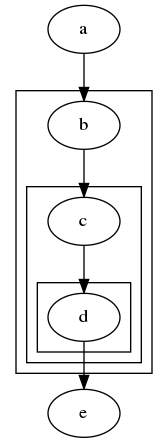
集群

集群可以根据需要嵌套:

1
2
3
4
5
6
7
8
9
10
11
12
13
digraph MyGraph {
subgraph cluster_a {
subgraph cluster_b {
subgraph cluster_c {
d
}
c -> d
}
b -> c
}
a -> b
d -> e
}

嵌套集群

HTML

HTML使我们可以创建更复杂的节点,这些节点可以分为多个部分。可以在图中独立地引用每个部分:

1
2
3
4
5
6
7
8
9
10
11
12
13
14
15
16
17
18
19
20
21
22
23
24
25
26
27
28
29
30
31
digraph MyGraph {
a [shape=plaintext,label=<
<table>
<tr>
<td>Hello</td>
<td>world!</td>
</tr>
<tr>
<td colspan="2" port="a1">are you ok?</td>
</tr>
</table>
>]
b [shape=plaintext,label=<
<table border="0" cellborder="1" cellspacing="0">
<tr>
<td rowspan="3">left</td>
<td>top</td>
<td rowspan="3" port="b2">right</td>
</tr>
<tr>
<td port="b1">center</td>
</tr>
<tr>
<td>bottom</td>
</tr>
</table>
>]

a:a1 -> b:b1
a:a1 -> b:b2
}

HTML节点

只有HTML的一个子集可用于创建节点,并且规则非常严格。为了使节点正确显示,我们需要将设置shapeplaintext

需要注意的另一件事是port属性,它使我们可以使用冒号(a:a1)来引用该特定单元格。

我们可以设置HTML节点的样式,但只能使用HTML的子集:

1
2
3
4
5
6
7
8
9
10
11
12
13
14
15
digraph MyGraph {
a [shape=plaintext,label=<
<table>
<tr>
<td color="#ff0000" bgcolor="#008822"><font color="#55ff00">Hello</font></td>
<td>world!</td>
</tr>
<tr>
<td colspan="2" color="#00ff00" bgcolor="#ff0000">
<font color="#ffffff">are you ok?</font>
</td>
</tr>
</table>
>]
}

HTML节点样式

图片

有时我们想为节点使用指定图标,这可以通过image属性来完成:

1
2
3
4
5
6
7
8
9
10
11
12
13
14
15
16
17
18
19
20
21
22
23
24
25
digraph MyGraph {
ec2 [shape=none,label="",image="icons/ec2.png"]
igw [shape=none,label="",image="icons/igw.png"]
rds [shape=none,label="",image="icons/rds.png"]
vpc [shape=none,label="",image="icons/vpc.png"]

subgraph cluster_vpc {
label="VPC"

subgraph cluster_public_subnet {
label="Public Subnet"
ec2
}

subgraph cluster_private_subnet {
label="Private Subnet"
ec2 -> rds
}

vpc
igw -> ec2
}

users -> igw
}

节点图片

Rank

等级是最难理解的事情之一,因为它们会改变渲染引擎的工作方式。在这里,我将介绍一些我认为有用的基本知识。

图表通常会从上到下呈现:

1
2
3
4
5
6
digraph MyGraph {
a -> b
b -> c
a -> d
a -> c
}

上下图

使用rankdir属性,我们可以从左到右渲染它:

1
2
3
4
5
6
7
8
digraph MyGraph {
rankdir=LR

a -> b
b -> c
a -> d
a -> c
}

左右图

排名还可以用于强制一个节点与另一个节点处于同一级别:

1
2
3
4
5
6
7
8
9
10
digraph MyGraph {
rankdir=LR

a -> b
b -> c
a -> d
a -> c

{rank=same;c;b}
}

等级=相同

在上面的示例中,我们用于rank=same将node c与node 对齐b

rankdir属性是全局属性,因此无法在集群内部更改,但是使用rank我们可以模拟LR集群内部的方向:

1
2
3
4
5
6
7
8
9
10
11
12
13
14
15
16
17
18
digraph MyGraph {
subgraph cluster_A {
a1 -> a2
a2 -> a3

{rank=same;a1;a2;a3}
}

subgraph cluster_B {
a3 -> b1
b1 -> b2
b2 -> b3

{rank=same;b1;b2;b3}
}

begin -> a1
}

等级=集群内部相同

我们可以结合rank使用constraint=false以创建更紧凑的图形:

1
2
3
4
5
6
7
8
9
10
11
12
13
14
15
16
17
18
19
20
21
22
23
digraph MyGraph {
subgraph cluster_A {
a1
a2
a3
{rank=same;a1;a2;a3}
}

subgraph cluster_B {
b1
b2
b3

{rank=same;b1;b2;b3}
}

begin -> a1
a1 -> a2 [constraint=false]
a2 -> a3 [constraint=false]
a3 -> b1
b1 -> b2
b2 -> b3
}

Graphviz约束

等级还可以用于指定每个节点之间的距离:

1
2
3
4
5
6
7
digraph MyGraph {
rankdir=LR
ranksep=1
a -> b
b -> c
c -> d
}

朗塞普

其缺省值ranksep.5

总结

在这篇文章中,我们学习了如何使用 Graphviz 基于声明性语言生成图。这使我在将来更容易绘制架构图并对其进行修改。

我介绍了我认为对于日常使用最重要的功能,但是坦率地说,很多功能我仍还不了解。